This is the first in a two-part series on telling your compelling story with data. In this post we'll get organized and get comfortable working with data.
How does that grab you?

It probably doesn’t.
Do you ever feel like you’re being bombarded with data?
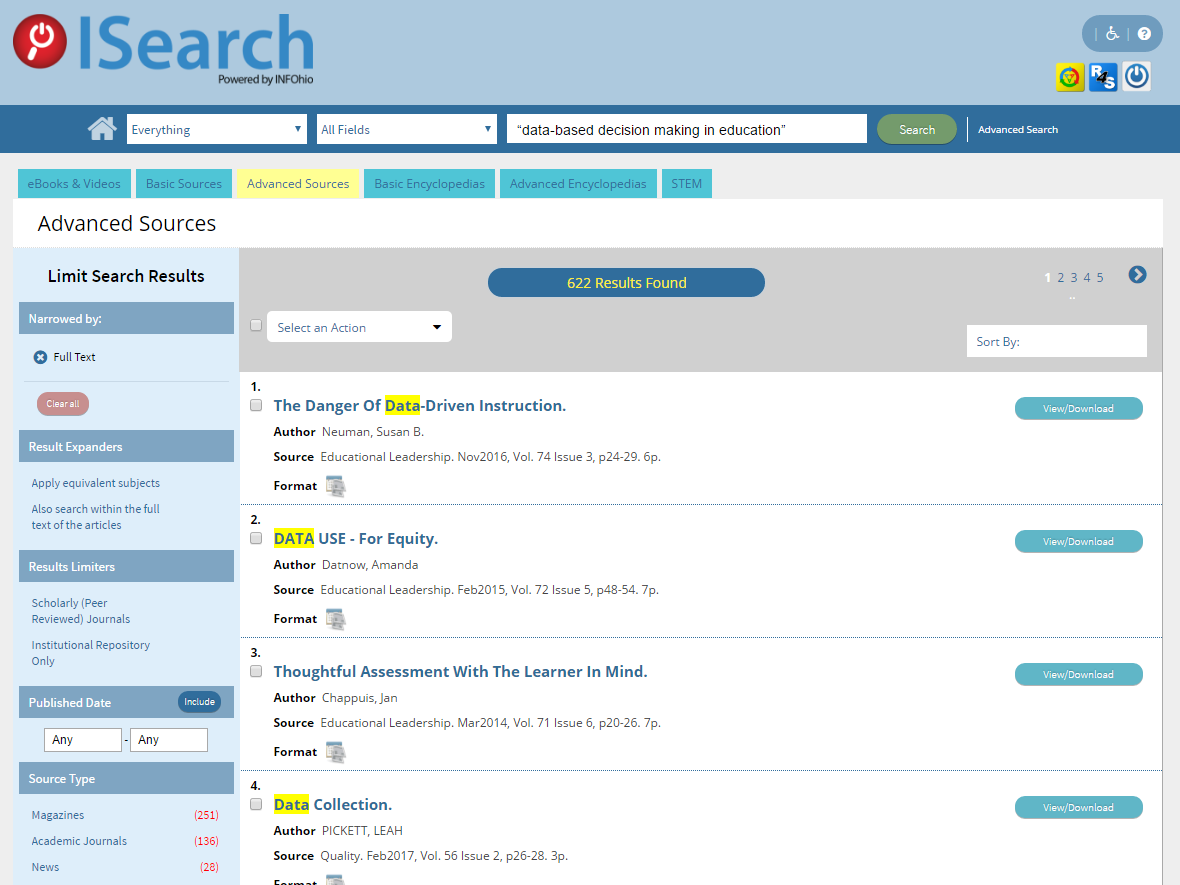
Try a search in ISearch for “data-based decision making in education” and look at the more than 900 results on the Advanced Sources tab.
The concept of gathering and analyzing education data and using that data to make decisions about educational practices has been around for years. Within the last few years, though, data-driven decision making has exploded and data analysis has become its own field of study with universities offering undergraduate degrees in data analytics.
Increasingly, educators are asked to supply data for their educational initiatives
Today’s educators have to be data literate: knowing how “to access, interpret, act on, and communicate data effectively and ethically” (Mandinach et al p. 28). Not only do we have to be adept data managers, safely collecting and organizing all the figures we’ll be asked to retrieve at some point, but we also have to find ways to make our data compelling. As the AASL Toolkit for Promoting School Library Programs says, “When it comes to getting your message across, how you share information can be as important as what you say” (p. 25).
Find your data: start counting
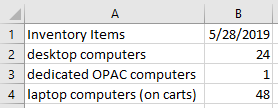
How many desktop computers are in your library? How many laptop carts do you manage? How many students used your space today? How many times did you help students find the perfect book today?
If you don't know the answers to all of those questions, it's time for you to start counting. First, take an inventory of your space and resources. Write down the items you're counting and the number of each. Date your document. You'll use this information below.
If you are not already collecting essential library service data, begin now. This can be as simple as keeping an hourly tally-sheet of reference or readers advisory questions you answer in a notebook at your desk, or it can be as fancy as using a Google Form to have students sign into your library to get an hourly head-count.
Think outside the usual library service box. Did you curate online instructional materials for a classroom teacher? Record either the number of materials you collected or the minutes spent providing that service. Were you a staff advisor for a student club? Count the number of meetings you helped facilitate or the minutes spent providing that service.
Find your data: start searching
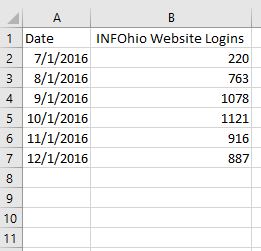
INFOhio is able to share use data for ISearch (if your school is automated with INFOhio) and for many electronic resources. Read more about the data INFOhio can provide on the INFOhio Resource Use Data page. After reading about the data that is available, click the green Open button and begin downloading the monthly spreadsheets. Download all of the INFOhio Website Logins spreadsheets for the most recent school year and find your school district in each. You'll use this information below.
Review the reports in the Report Favorites section of the Library Services Handbook. Could any of those reports help you illustrate how your library improves literacy or reading proficiency?
Look through freely available census, education, and library data. As you do, consider whether there are any data sets that might add info about specific needs in your school community, or whether a single statistic can help illustrate the story you will tell.
Get organized
Whether you use Microsoft Excel, Google Sheets, or Apple Numbers, you’re going to need to get comfortable with software that lets you keep track of and manipulate data. Spreadsheets are ideal for that. Excel, Sheets, and Numbers behave similarly so if you’re comfortable in one, you can likely use any of the three. However, since you run the risk of losing formula references or reformatting your graphics if you go back and forth between applications, it’s best to choose one and stick with it. Learn the keystroke shortcuts and which menu houses which functions. If you aren’t comfortable with one of those applications, you can get free online training on Excel through the Ohio Means Jobs site.
If you have a library card from one of Ohio's public libraries, you can use Lynda.com (LinkedIn Learning) to improve skills in working with spreadsheets and data.
We'll practice with some basic data. Create a spreadsheet workbook that you will use to manage your data. Name the first spreadsheet in the workbook Inventory. In the first column of that spreadsheet, record the name of the item you are counting. In the second column, record the date of your inventory and the number of items.
Update your inventory annually.
Now create a new spreadsheet in that workbook called INFOhio Use Data where you can keep track of your district’s monthly INFOhio use data. In the first column, record the month and year. In the second column, record the number of INFOhio website logins. (You collected this information above from the INFOhio Resource Use Data page.) Add additional columns for other INFOhio resources and record the use. For example, you can add BookFlix Documents Retrieved each month to column C. Each month, download the new stats as they become available and add them to your spreadsheet.
Spend some time getting comfortable with your data. Then read Part 2 of "Tell Your Compelling Story with Data" to work on making your data speak!
Erica Clay is the Director of INFOhio. Prior to this, she was a member of INFOhio's Instructional Team. Before joining the INFOhio team, Erica was a Library Director and a Humanities Librarian in academic libraries, a Knowledge Management Editor at a university, and taught K-8 music and PreK. She earned a BA in English and Music and a Master of Humanities from Wright State University, and a Master of Library Science from Indiana University.


Fetch is avaiable to INFOhio automated schools. If you are an INFOhio school, please log in with your school username/password using the button at the top-left corner of this page.
For more information about Fetch, please visit the Fetch information page or contact INFOhio support at https://support.infohio.org.
