This is the Sanborn Insurance Maps homepage. Search over 40,000 detailed maps of Ohio cities drawn from 1882-1962. To find maps of a city in Ohio, type the city you are looking for in the search box. The city will auto-populate in the drop-down menu. When you see the city appear in the drop-down menu, click on it to see your search results.
You will find on the search results page that not every year is represented for every city. For example, a search for "Delaware" in the search box results in maps from the years: 1885, 1890, 1895, 1901, 1911, 1923, and 1923-1950.
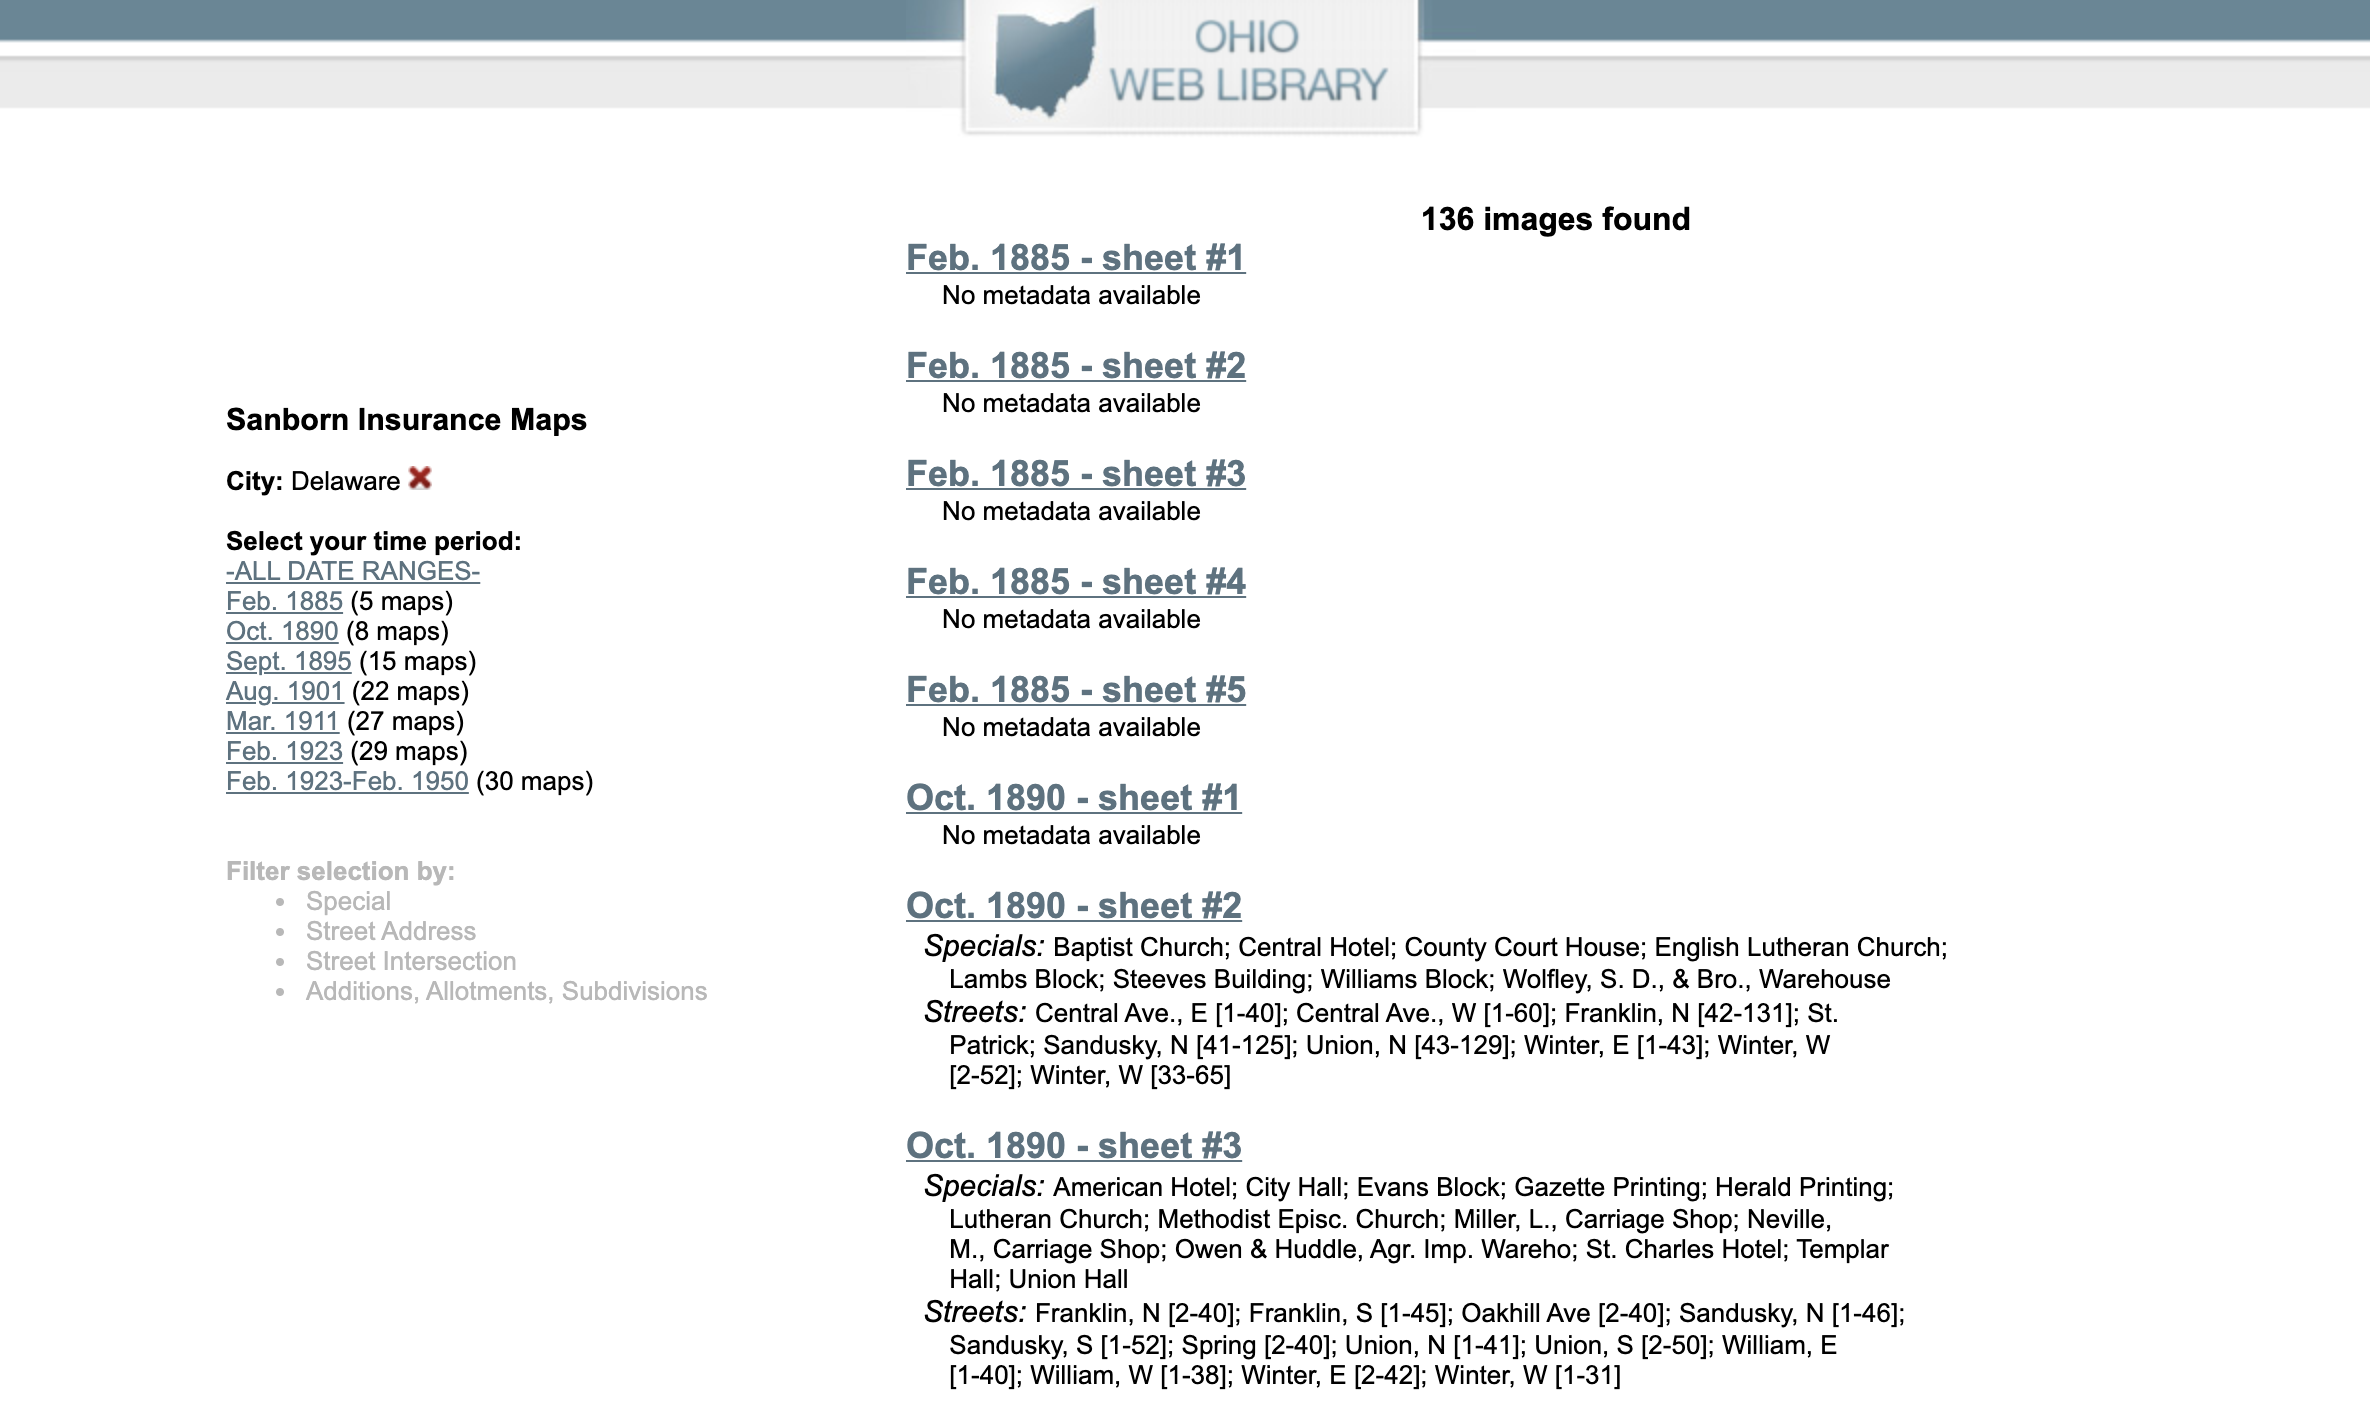
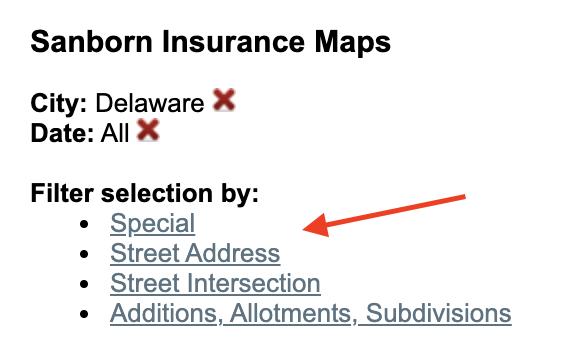
You can also narrow your search results by clicking on "-ALL DATE RANGES-" and then filtering selection by Special, Street Address, Street Intersection, and Additions, Allotments, Subdivisions. With the Special filter you can search by specific keywords; e.g. hotel, library, university, etc. Special items were identified as major businesses, public buildings, factories, or other large structures. With the Street Address and Street Intersection filters you can search by street names.

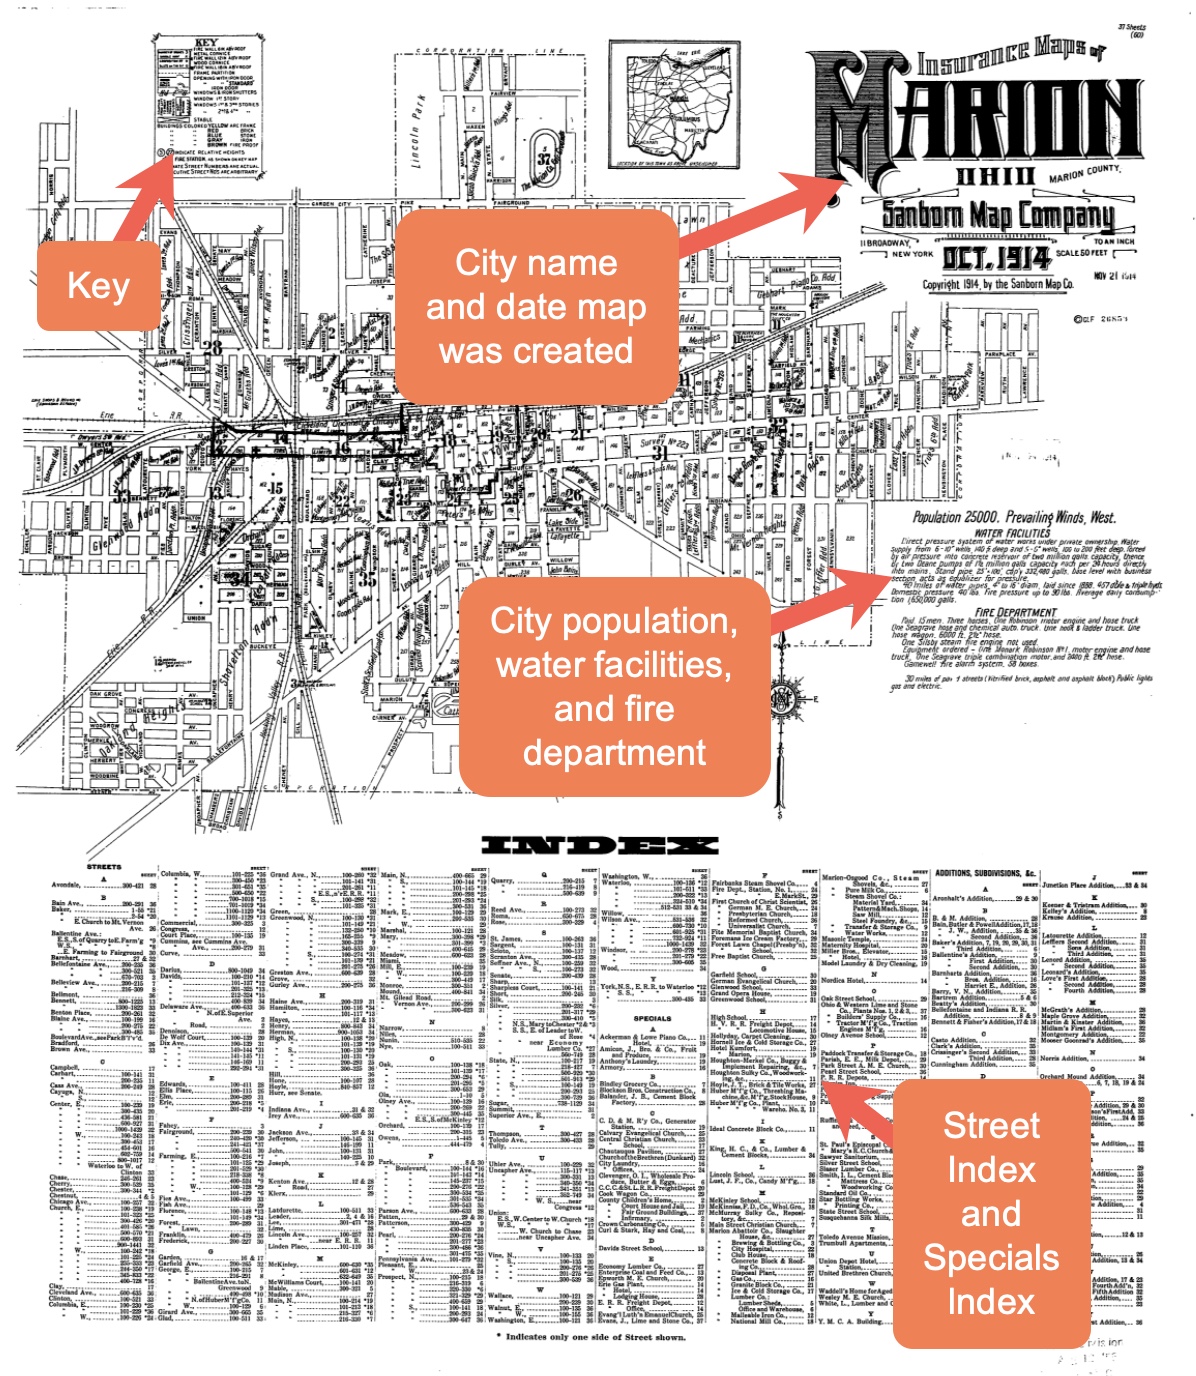
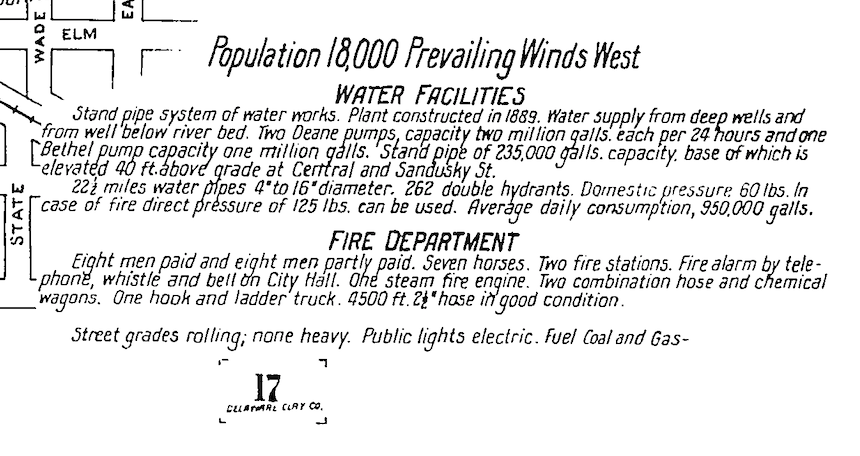
To fully understand and read Sanborn Insurance Maps, you must learn about the parts of the map. Important parts of the map include, key, symbols, index, line styles, abbreviations, and interpreting scale. Each city may have multiple years of maps; the first map for that particular year begins with a map called Sheet #1. Sheet #1 includes the overview information below about the city including population, water facilities, fire department, indexes and key. Abbreviations and scales can be found in more detail on the next Sheets in the series for that city and year.
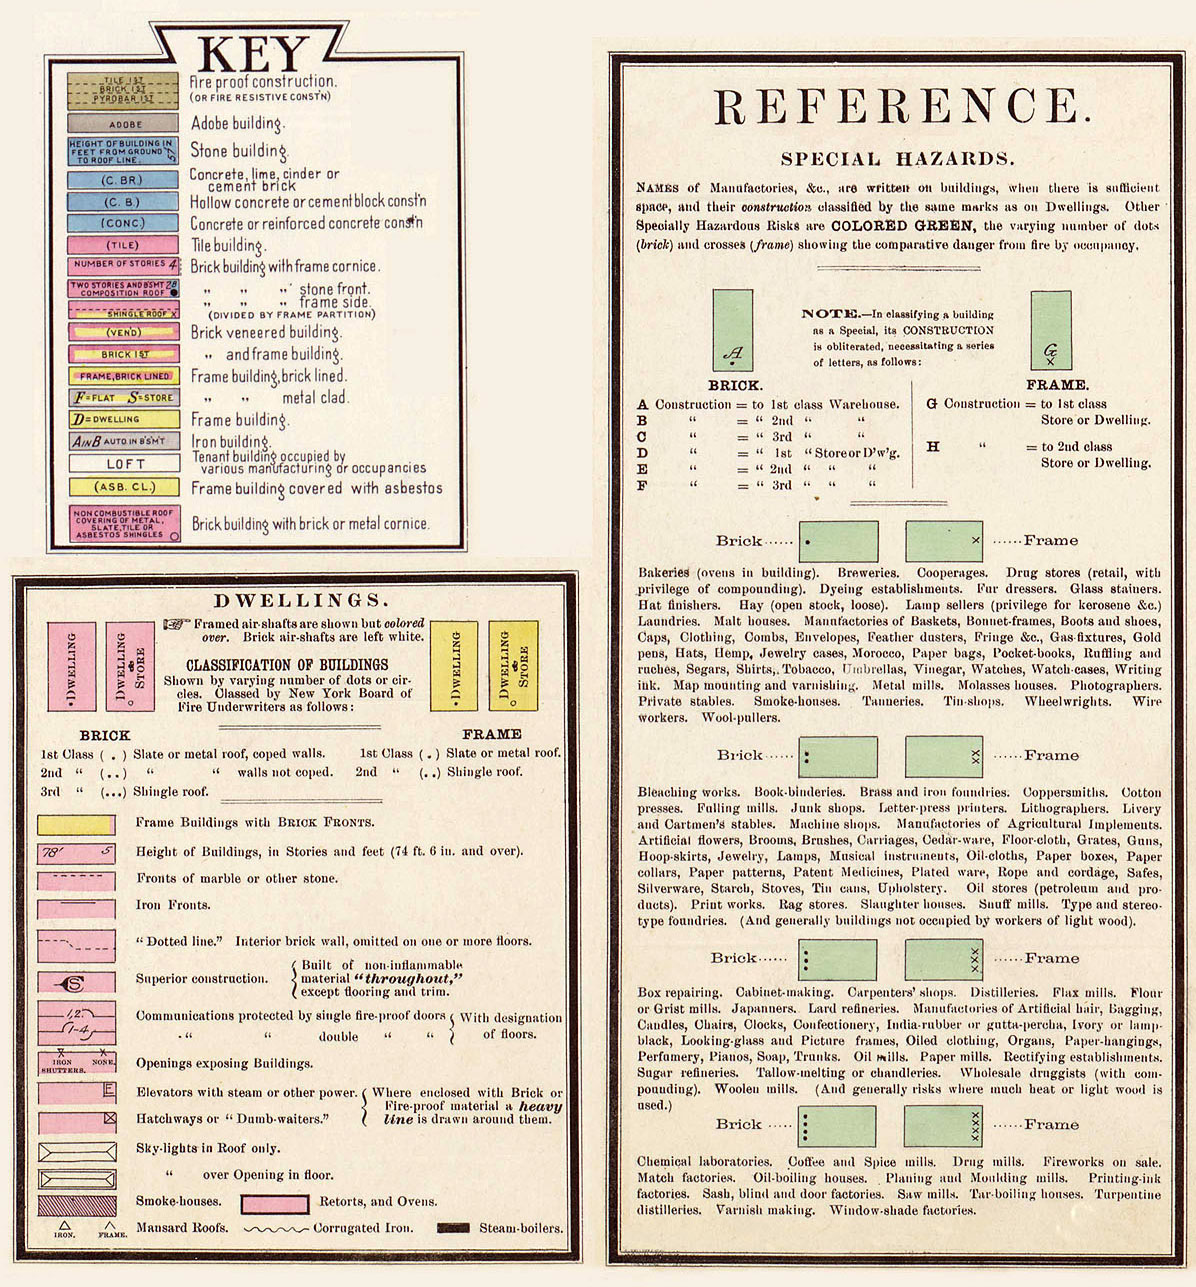
Keys, Colors, and Symbols
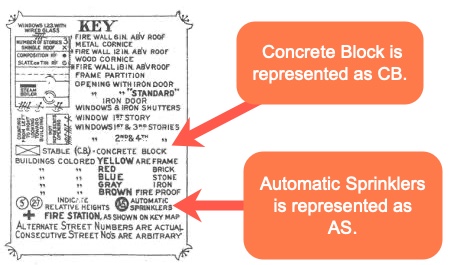
The Ohio Sanborn Insurance Maps have been scanned and uploaded in this database from microfilm, so these maps are in black and white. Even though the color key will not work with these particular maps, the textual key elements and symbols are still applicable.
For example, in this black and white Key, the textual symbols of CB for Concrete Block and AS for Automatic Sprinklers will still apply to black and white maps. Also, the tally marks indicating the number of Iron Door Windows & Iron Shutters is applicable.
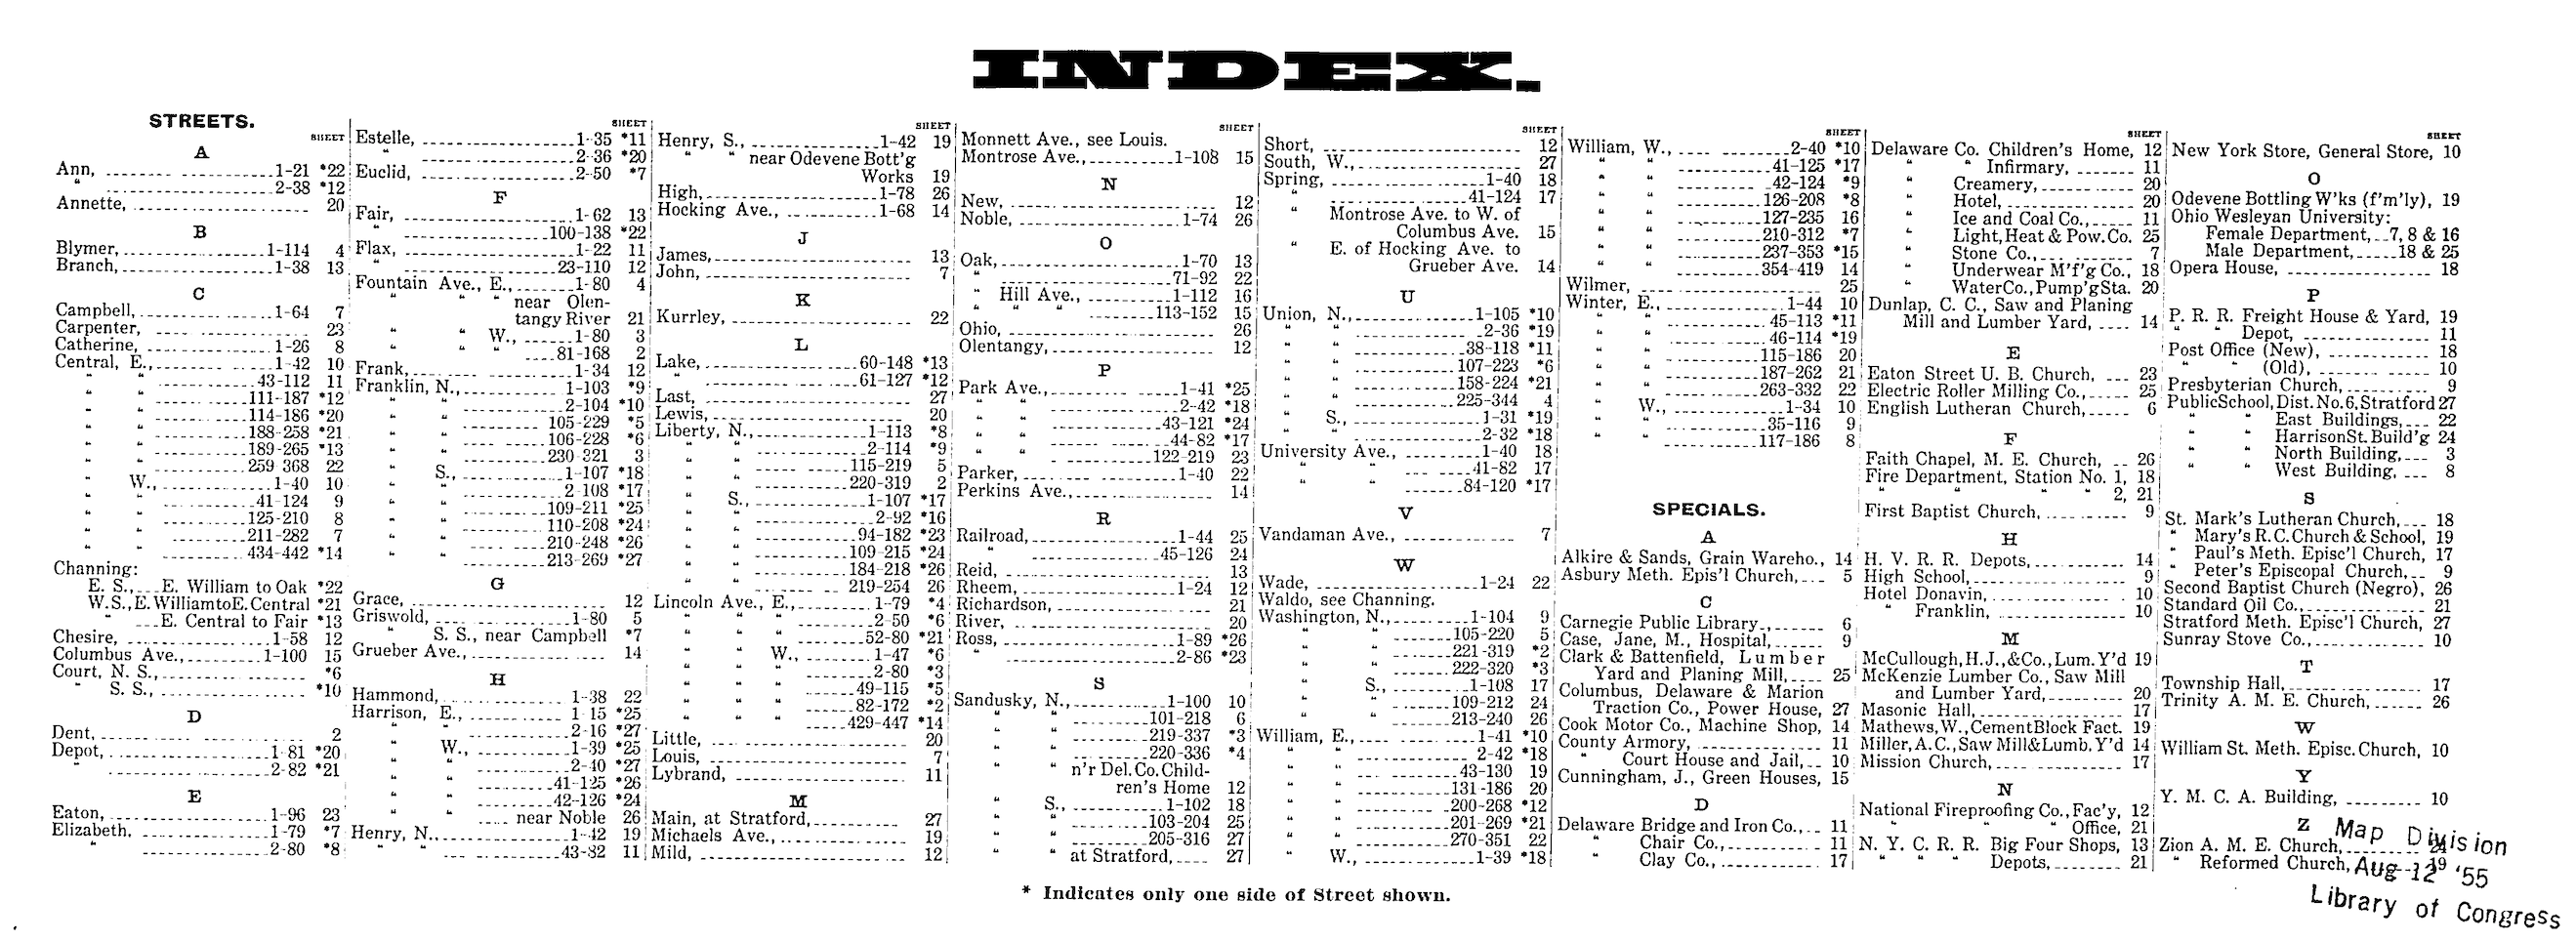
Indexes
Street Indexes list street names in alphabetical order. When reading historical maps, remember that street names can change over time. This is something to keep in mind, if trying to find a specific street address. Special Indexes are a unique look at a city's economic and social landscape at a specific point in time. Buildings included under special indexes could be churches, factories, warehouses, hospitals, and libraries.
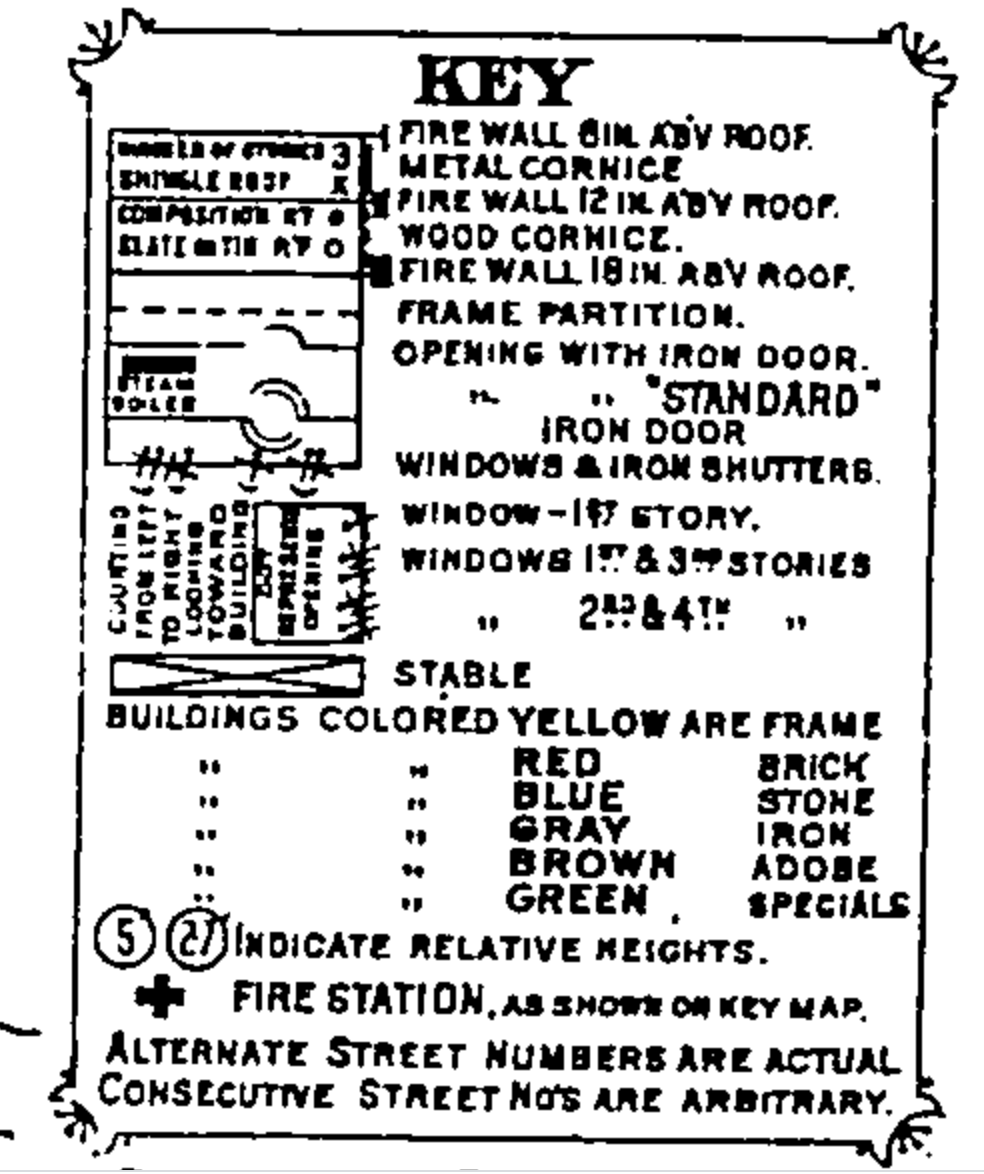
Line Styles
Maps are created by drawing and connecting lines in all types and forms. Typically a solid line indicated a wall and a break in a line showed doorways or passageways. Although this was a common interpretation of these lines, researchers are still encouraged to use the key and thoroughly investigate each map to make sure it is being read correctly. For example, in the key shown below, dashed lines meant partitions and tally marks indicated the number of windows and iron shutters.
Abbreviations
Abbreviations are commonly used on maps. Some common abbreviations found on Sanborn Insurance Maps include:
For a complete list of Sanborn Insurance Map Abbreviations view the document in the exercise files below.
Reports on Fire Protection Services and Infrastructure
The original purpose of Sanborn Insurance Maps was to assist fire insurance agents in figuring out the degree of fire hazard of a particular property. Included on the maps is a report of the water facilities and fire department services in each city.
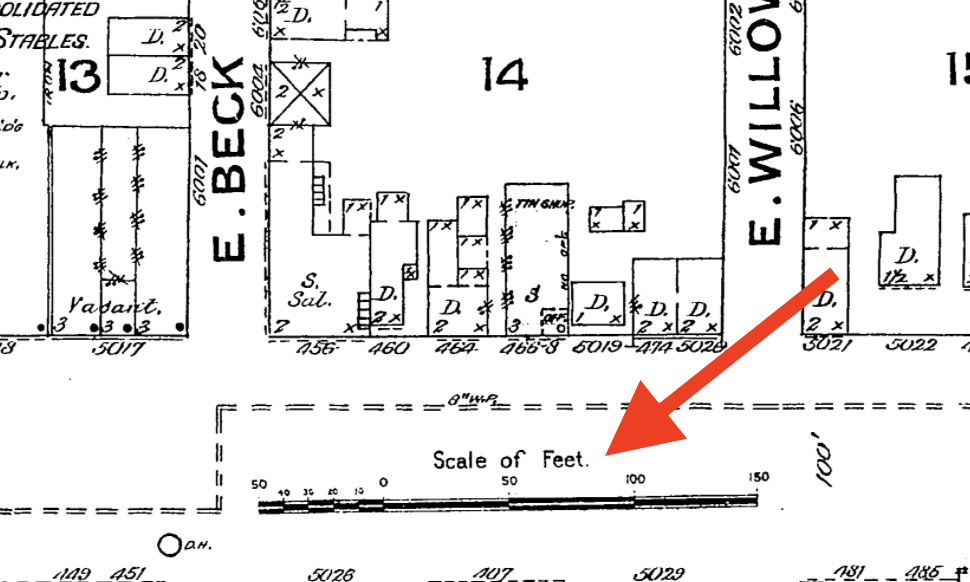
Interpreting Scale
Fire insurance maps were most commonly drawn at a scale of 50 feet per inch (1:600) or 100 feet per inch (1:1200). Most map sheets contain a scale, like the one shown below, that helps determine the measurement of features and distances.

Fetch is avaiable to INFOhio automated schools. If you are an INFOhio school, please log in with your school username/password using the button at the top-left corner of this page.
For more information about Fetch, please visit the Fetch information page or contact INFOhio support at https://support.infohio.org.
